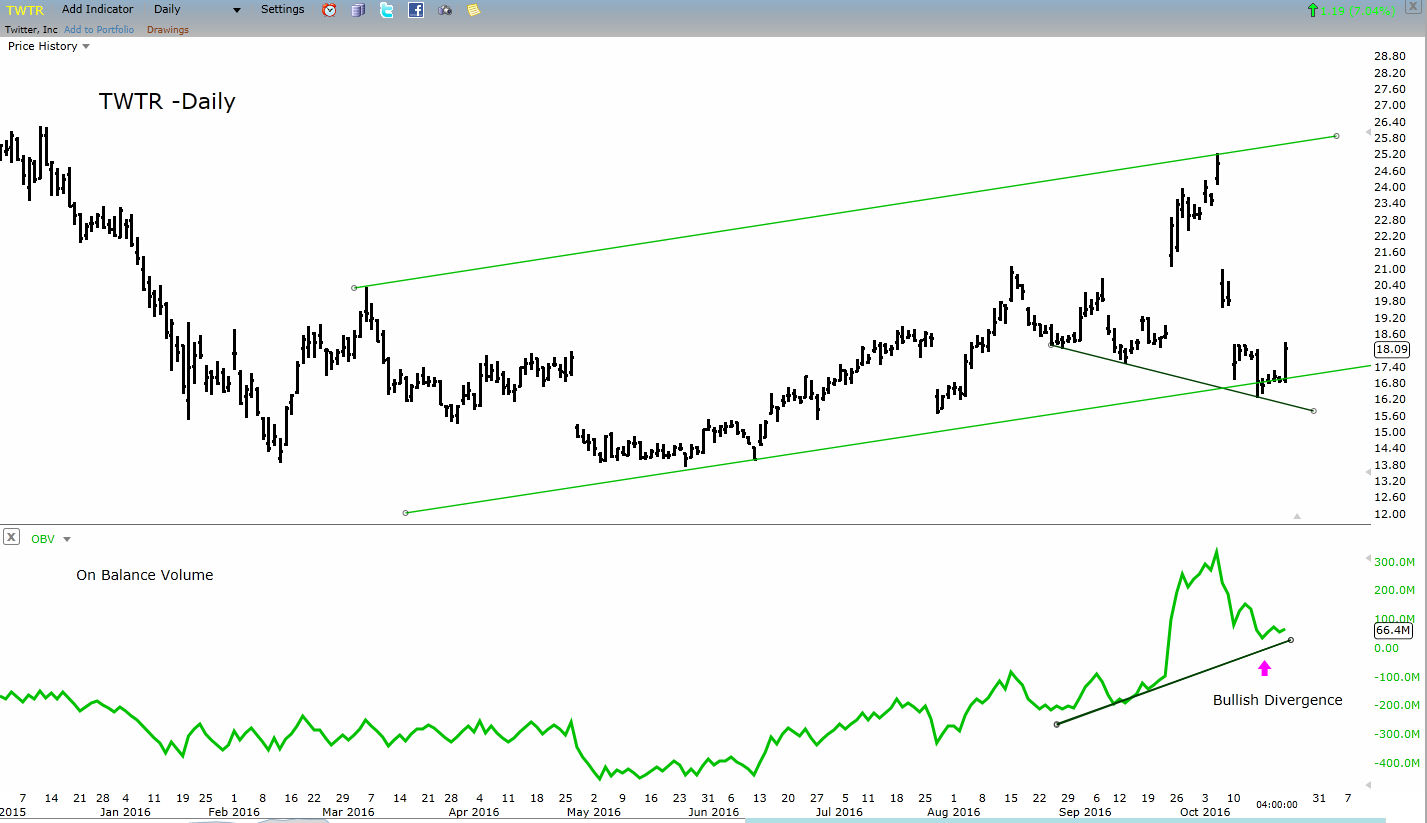
Above is a daily chart of TWTR and in the lower panel is the On Balance Volume indicator. As you can see TWTR is now testing the lower range of its ascending channel and appears to be turning upward thanks to buyout rumors which hit the tape late Friday afternoon. You can read more about that story here.
The On Balance Volume indicator which tracks money flows is clearly diverging from the market. As TWTR makes a lower low the OBV indicator clearly makes a much higher low setting up a bullish divergence. This suggests money is flowing into the stock and in my opinion is quite bullish setting up a potential rally to the upper channel line. . TWTR closed up $1.19 or 7.04% from Thursday's close.